Materials / Perennial crops
Miscanthus-lime lightweight concrete block
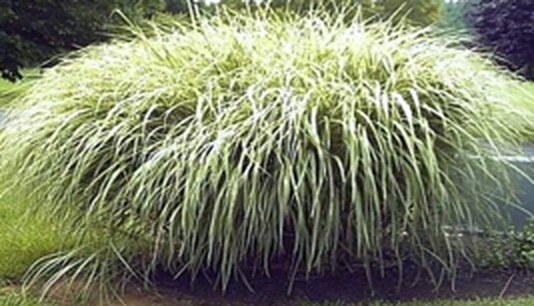
Miscanthus x giganteus, 20-year plantation
Rhizomes are planted once and the crop is harvested every spring for about 20 years. Chopped miscanthus shiv is mixed with a lime binder at binder/aggregate = 2 and cast into blocks.
Declared unit: 1 m³ of installed miscanthus-lime blockwork, 450 kg/m3 dry
Across the steps that could be counted, one declared unit releases about 264.7 kg CO2e of fossil greenhouse gases (range 229.7 to 305.5). The largest share comes from growing, harvesting and raw materials (A1, 96%). The material itself holds 248 kg of CO2 that the plants absorbed while growing. 12 of 26 burden flows have a number; the rest are marked as gaps below.
Every step, field to wall
Each tag is one process. Its colour shows the weakest evidence among its flows, and the number is its fossil CO2e in kg. Select a tag to open its rows in the inventory.
A1 Growing, harvesting and raw materials
Site preparation
Establishment
- Rhizome production and lifting
- Rhizome transport to the field
- Rhizome planting <0.1
- Rolling after planting
- Weed control, years 1-2 <0.1
Crop management
Harvest
End of plantation
Field emissions
Aggregate production
Binder production
A3 Making the product
Block plant
- S Sourced
- D Derived
- P Proxy
- A Assumption
- G Gap
- I Information
Where the fossil emissions happen
Bars add up counted flows only. The whiskers span the low and high cases from the ranges of amounts and emission factors.
Checks and stored carbon
- Comparison with a published EPD
- No A1-A3 value retrieved for miscanthus-lime blocks
Source reports net capture of 135 kg CO2e/m3 over 100 years incl. carbonation. Ntimugura et al. 2021 - Carbon stored in the material
- 150.0 kg dry mass x 0.45 C x 44/12 = 247.5 kg CO2 removed in A1 (reported separately).
Carbon fraction 0.45 assumed for miscanthus; replace with measured value. – - Carbonation potential of binder (use stage B1, not in A1-A5)
- up to 178.2 kg CO2 if fully carbonated
= 0.594 x binder mass; real uptake is partial and slow. IBU PCR (carbonation) - Miscanthus biomass net GHG incl. soil carbon (US)
- about +130 to -260 kg CO2e per t biomass for yields 5-25 t/ha
Context for the unquantified SOC step. Adler 2023
Assumptions and key inputs
Change these per project by editing the data package. Values marked Assumption are the first ones to replace with real data.
| Parameter | Value | Status | DQ | Source | Note |
|---|---|---|---|---|---|
| Binder/aggregate mass ratio | 2 - | S | 2 | Ntimugura, WESSEX 2021; Ntimugura et al. 2021 | |
| Dry density | 450 kg/m3 | D | 3 | Ntimugura, WESSEX 2021 | Midpoint of 400-500 kg/m3. |
| Miscanthus shiv per DU | 150 kg | D | 3 | – | = 450/3. |
| Lime binder per DU | 300 kg | D | 3 | – | = 450 x 2/3. |
| Plateau yield | 12 t DM/ha/yr | S | 3 | Terravesta; Adler 2023 | Lower end of 12-17 t/ha; US commercial fields often lower. |
| Lifetime harvested dry matter | 210 t DM/ha | D | 4 | NNFCC 2011; Terravesta | Harvests years 2-20; years 2-4 at 50% (yield-building phase). |
| Rhizome planting density | 15 000 rhizomes/ha | S | 2 | Dzeletovic et al. 2016 | |
| Conversion: ha x plantation lifetime per DU | 0.000714 | D | = 0.15 t / 210.0 t/ha | ||
| Conversion: t DM shiv per DU | 0.15 | D |
Inventory
One row per flow. "Per DU" converts the amount to one declared unit; kg CO2e = per DU x emission factor.
| Flow | Amount | Basis | Per DU | Emission factor | kg CO2e | Status | DQ | Source | Note |
|---|---|---|---|---|---|---|---|---|---|
| A1 Site preparation / Pre-planting herbicide 0.0019 kg CO2e Clean seedbed required. | |||||||||
| Diesel, sprayer | 0.85 L 0.4–1.3 |
per ha | 0.00061 | Diesel, non-road (GNR), combustion + upstream 3.16 kg CO2e/L |
0.0019 | Proxy | 3 | INRAE 2022 fuel guide; Terravesta | |
| Herbicide a.i. | ? kg | per ha | – | no open factor | – | Gap | 5 | – | |
| A1 Site preparation / Autumn ploughing 0.03 kg CO2e | |||||||||
| Diesel | 15 L 10–20 |
per ha | 0.01071 | Diesel, non-road (GNR), combustion + upstream 3.16 kg CO2e/L |
0.034 | Proxy | 3 | INRAE 2022 fuel guide; NNFCC 2011 | |
| A1 Site preparation / Spring rotary cultivation 0.02 kg CO2e | |||||||||
| Diesel | 10 L 5–15 |
per ha | 0.00714 | Diesel, non-road (GNR), combustion + upstream 3.16 kg CO2e/L |
0.023 | Proxy | 3 | INRAE 2022 fuel guide; NNFCC 2011 | |
| A1 Establishment / Rhizome production and lifting Nursery fields lifted to supply rhizomes. | |||||||||
| Rhizomes | 15 000 rhizome | per ha | 10.71429 | no open factor | – | Sourced | 2 | Dzeletovic et al. 2016 | Amount sourced; nursery burden not available. |
| A1 Establishment / Rhizome transport to the field Lifted rhizomes trucked from the nursery field. | |||||||||
| Truck transport | ? t.km | per ha | – | Road freight, articulated truck 34-40 t 0.0875 kg CO2e/t.km |
– | Gap | 5 | – | Rhizome mass per ha and distance not sourced. |
| A1 Establishment / Rhizome planting 0.03 kg CO2e Specialised planter, 10-20 ha/day. | |||||||||
| Diesel | 12.5 L 10–15 |
per ha | 0.00893 | Diesel, non-road (GNR), combustion + upstream 3.16 kg CO2e/L |
0.028 | Proxy | 4 | INRAE 2022 fuel guide; NNFCC 2011 | Proxy: combined sowing 10-15 L/ha. |
| A1 Establishment / Rolling after planting | |||||||||
| Diesel | ? L | per ha | – | Diesel, non-road (GNR), combustion + upstream 3.16 kg CO2e/L |
– | Gap | 5 | – | |
| A1 Establishment / Weed control, years 1-2 0.0038 kg CO2e Two herbicide passes. | |||||||||
| Diesel, sprayer | 1.7 L 0.8–2.6 |
per ha | 0.00121 | Diesel, non-road (GNR), combustion + upstream 3.16 kg CO2e/L |
0.0038 | Proxy | 3 | INRAE 2022 fuel guide | 2 x 0.85 L/ha. |
| Herbicide a.i. | ? kg | per ha | – | no open factor | – | Gap | 5 | – | |
| A1 Crop management / Fertilisation No N, P or K required after establishment. | |||||||||
| Mineral N | 0 kg N | per ha | 0 | Mineral N fertiliser (ammonium nitrate), production 3.6 kg CO2e/kg N |
0.000 | Sourced | 3 | Terravesta | |
| A1 Harvest / Annual spring harvest with forage harvester 1.00 kg CO2e Harvest dominates machinery GHG (>90%). | |||||||||
| Diesel, forage harvester | 2.1 L 1.9–2.3 |
per tdm | 0.315 | Diesel, non-road (GNR), combustion + upstream 3.16 kg CO2e/L |
0.995 | Proxy | 4 | INRAE 2022 fuel guide; Adler 2023 | Proxy: maize silage 1.9-2.3 L/t DM. |
| A1 Harvest / Field-edge haulage and storage | |||||||||
| Diesel | ? L | per tdm | – | Diesel, non-road (GNR), combustion + upstream 3.16 kg CO2e/L |
– | Gap | 5 | – | |
| A1 End of plantation / Reconversion (herbicide + ploughing out rhizomes) 0.04 kg CO2e | |||||||||
| Diesel, sprayer | 0.85 L 0.4–1.3 |
per ha | 0.00061 | Diesel, non-road (GNR), combustion + upstream 3.16 kg CO2e/L |
0.0019 | Proxy | 3 | INRAE 2022 fuel guide | |
| Diesel, ploughing | 15 L 10–20 |
per ha | 0.01071 | Diesel, non-road (GNR), combustion + upstream 3.16 kg CO2e/L |
0.034 | Proxy | 3 | INRAE 2022 fuel guide | |
| A1 Field emissions / Soil organic carbon change Soil carbon is the main sink for yields above 5 t/ha. | |||||||||
| SOC change | ? kg CO2 | per DU | – | no open factor | – | Gap | 5 | Adler 2023 | Report under GWP-luluc when quantified. |
| A1 Aggregate production / Chopping, sieving and dedusting to shiv | |||||||||
| Electricity | ? kWh | per DU | – | Electricity, France average consumption mix 2024 0.058 kg CO2e/kWh |
– | Gap | 5 | – | |
| A1 Binder production / Lime binder manufacture 252.00 kg CO2e Hydrated lime used as proxy for the formulated lime binder. | |||||||||
| Lime binder | 300 kg | per DU | 300 | Hydrated lime Ca(OH)2, production (calcination + kiln fuel) 0.84 kg CO2e/kg |
252.000 | Derived | 3 | EC lime benchmark study; EMEP/EEA Guidebook lime; Ntimugura et al. 2021 | Binders cause about 75% of GHG in the source study. |
| A2 Transport / Shiv to block plant 0.66 kg CO2e | |||||||||
| Truck transport | 7.5 t.km 3–22.5 |
per DU | 7.5 | Road freight, articulated truck 34-40 t 0.0875 kg CO2e/t.km |
0.656 | Assumption | 4 | Truck 34-40 t default | = 0.15 t x 50 km. |
| A2 Transport / Binder to block plant 6.56 kg CO2e | |||||||||
| Truck transport | 75 t.km 30–150 |
per DU | 75 | Road freight, articulated truck 34-40 t 0.0875 kg CO2e/t.km |
6.563 | Assumption | 4 | Truck 34-40 t default | = 0.30 t x 250 km. |
| A3 Block plant / Mixing (pan mixer), water addition | |||||||||
| Electricity | ? kWh | per DU | – | Electricity, France average consumption mix 2024 0.058 kg CO2e/kWh |
– | Gap | 5 | – | |
| Water | ? L | per DU | – | no open factor | – | Gap | 5 | – | |
| A3 Block plant / Moulding and compaction | |||||||||
| Electricity | ? kWh | per DU | – | Electricity, France average consumption mix 2024 0.058 kg CO2e/kWh |
– | Gap | 5 | – | |
| A3 Block plant / Air curing 28-90 days, palletising | |||||||||
| No energy input (air curing) | 0 - | per DU | 0 | no open factor | – | Information | 3 | Ntimugura, WESSEX 2021 | |
| Pallets and film | ? kg | per DU | – | no open factor | – | Gap | 5 | – | |
| A4 Transport / Delivery to site 4.38 kg CO2e | |||||||||
| Truck transport | 50 t.km 25–100 |
per DU | 50 | Road freight, articulated truck 34-40 t 0.0875 kg CO2e/t.km |
4.375 | Assumption | 4 | Truck 34-40 t default | = 0.5 t (incl. residual moisture) x 100 km. |
| A5 Installation / Laying blocks with lime mortar | |||||||||
| Lime mortar | ? kg | per DU | – | Hydrated lime Ca(OH)2, production (calcination + kiln fuel) 0.84 kg CO2e/kg |
– | Gap | 5 | – | |
| Breakage and cuts | ? % | per DU | – | no open factor | – | Gap | 5 | – | |
| Total fossil CO2e, counted flows | 264.72 | range 229.66 to 305.48 | |||||||
Not included
- Manufacture of machinery, vehicles, factory buildings and forest roads (capital goods)
- Staff commuting, offices and research
- Use stage (B1-B7) and end of life (C1-C4, D); lime carbonation during use is shown as information only
- Land-use change and soil carbon, listed as gaps where relevant because they are site-specific
Sources used on this page
- Ntimugura et al. 2021. Ntimugura F., Vinai R., Harper A.B., Walker P. (2021). Environmental performance of miscanthus-lime lightweight concrete using LCA. Sustainable Materials and Technologies 28:e00253. Link
- Ntimugura, WESSEX 2021. Ntimugura F. et al. Mechanical and microstructural performance of low-carbon bio-based insulation (b/a = 2.0, dry density 400-500 kg/m3). Link
- NNFCC 2011. NNFCC (2011). Miscanthus crop factsheet: rhizome planting 10-20 ha/day, autumn ploughing and spring cultivation, useful life 15-20 years. Link
- Terravesta. Terravesta. Miscanthus grower information: yields 12-17 t/ha, 20+ year lifespan, no additional N/P/K after establishment. Link
- Dzeletovic et al. 2016. Dzeletovic Z., Mihailovic N., Simic A. (2016). Influence of scarce planting on the yield of Miscanthus x giganteus. J Processing and Energy in Agriculture 20(4):161-164 (recommended 15,000 rhizomes/ha). Link
- Adler 2023. Adler P.R. (2023). Life cycle inventory of Miscanthus production on a commercial farm in the US. Front Plant Sci 14:1029141. Link
- INRAE 2022 fuel guide. INRAE (2022). Bonnes pratiques economes en carburant: ranges in L GNR per ha / t / balle for tillage, sowing, spraying, mowing, tedding, raking, baling, silage. Link
- ADEME Base Empreinte (fuels). ADEME Base Empreinte, status 'valide generique': gazole non routier 3.16 kgCO2e/L; gazole routier B7 3.10 kgCO2e/L; electricite 2022 0.05 kgCO2e/kWh (combustion + upstream). Link
- ADEME Base Empreinte (electricity 2024). ADEME Base Empreinte, electricite mix moyen France 2024 = 58 gCO2e/kWh (as used by SNCF comparateur carbone). Link
- Truck 34-40 t default. Regulatory default 2026 for articulated truck 34-40 t: 0.0875 kgCO2e per t.km (as reported by Projet Celsius, from ADEME Base Empreinte). Link
- Yara AN footprint. Yara: ammonium nitrate from BAT plants = 3.6 kgCO2e/kg N; average European non-BAT plant about twice as high. Link
- EC lime benchmark study. European Commission (2009). Benchmarking study, lime sector: calcination process emissions 0.785 t CO2/t quicklime. Link
- EMEP/EEA Guidebook lime. EMEP/CORINAIR Guidebook B3312: combustion CO2 from lime kilns 0.2-0.45 t CO2/t quicklime. Link
- IBU PCR (carbonation). IBU PCR guidance: maximum CO2 uptake of hydrated lime = 44/74 = 0.594 kg CO2/kg Ca(OH)2. Link